How to Use Data Tools

Data tools allow you to extract, analyze, and monitor information from different sources such as social platforms, websites, and marketplaces. By configuring a data tool correctly, you can automate data collection and gain valuable insights.
1. Go to Alert Creation
Navigate to your Alerting Space and click "New Alert".
2. Choose Alert Type
Select "Regular Alert" if you want to monitor a single condition.
3. Select a Signal Source
Choose the platform you want to monitor (e.g., LinkedIn, Public Web, Reddit).
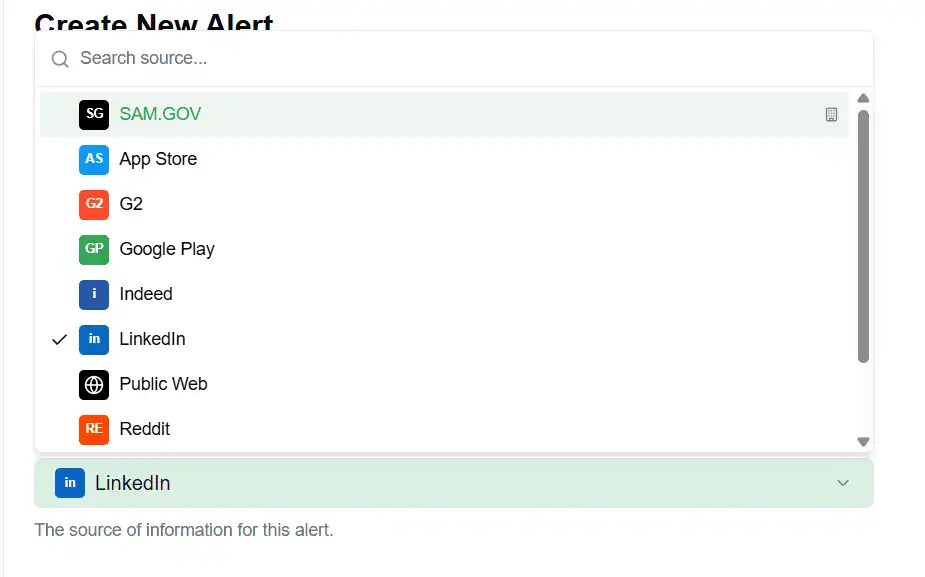 The signal source defines where your data will come from.
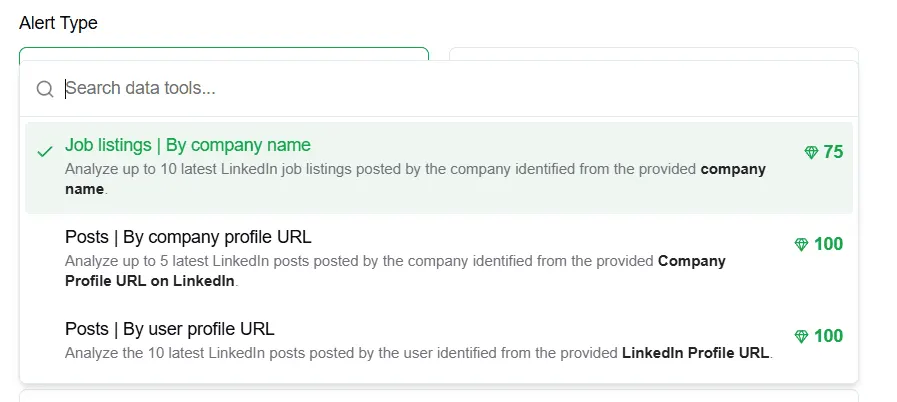
4. Select a Data Tool
After selecting a source, choose a data tool that defines how the data will be processed.
Different data tools provide different types of insights. For example:
Extract job listings
Track posts and updates
Monitor user activity
Analyze company profiles
5. Example: Using LinkedIn Data Tools
Here’s an example of how a data tool works using LinkedIn.
 For instance, you can select:
“Job listings | By company name”
This tool allows you to analyze recent job postings from a specific company.
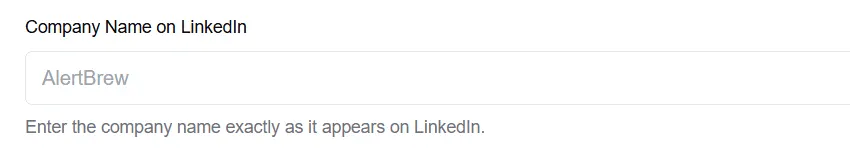
6. Provide Input Data
Enter the required data depending on the selected tool.
 Example:
Company Name: AlertBrew
Make sure the data matches the format required by the platform.
7. Define Your Condition
Write what you want to monitor or analyze.
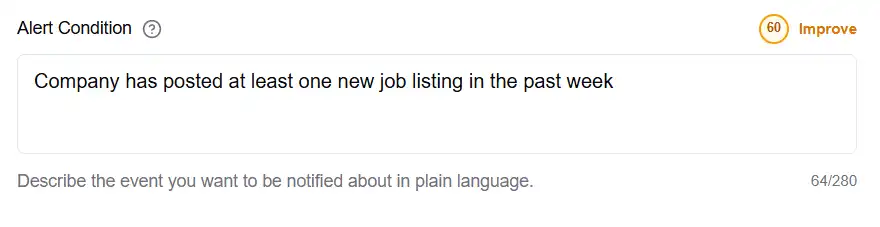 The clearer your condition, the more accurate the results.
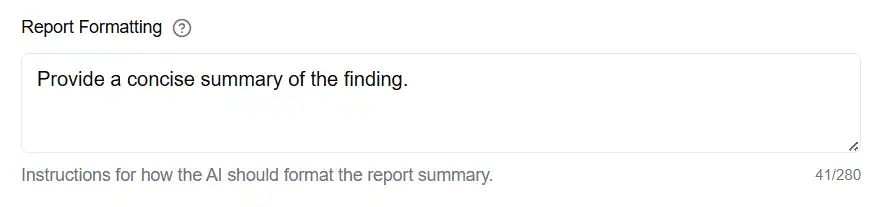
8. Configure Output Settings
(Optional) Customize how the results are displayed or delivered.
 9. Create and Activate
Click "Create Alert" to start monitoring.
The system will automatically process data using the selected tool and notify you when conditions are met.
10. Use Alert Groups
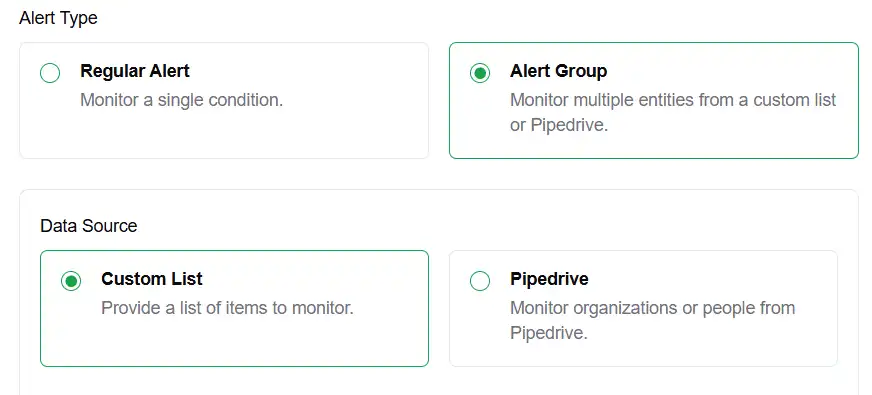 If you need to monitor multiple entities at once, use Alert Groups instead of creating separate alerts
This option allows you to track multiple items within a single alert configuration.
11. Select Data Source
Choose Custom List as your data source.
This allows you to define a list of items that will be monitored together.
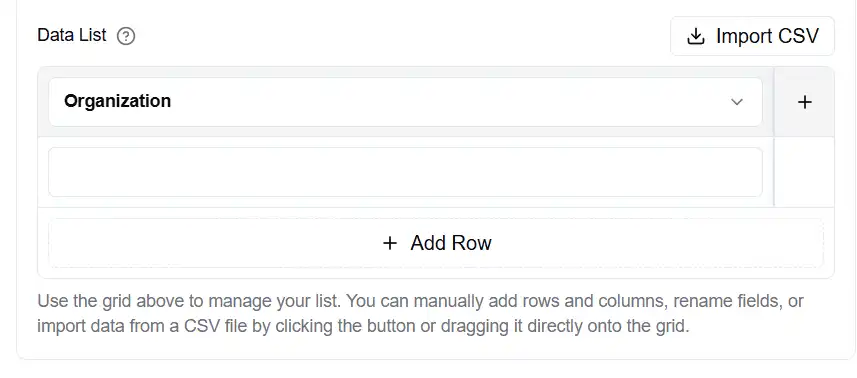
12. Build Your Data List
Use the grid interface to add your data.
 You can:
Add rows for each item
Add columns for additional data
Import a CSV file
Example:
Organization: AlertBrew
Organization: Google
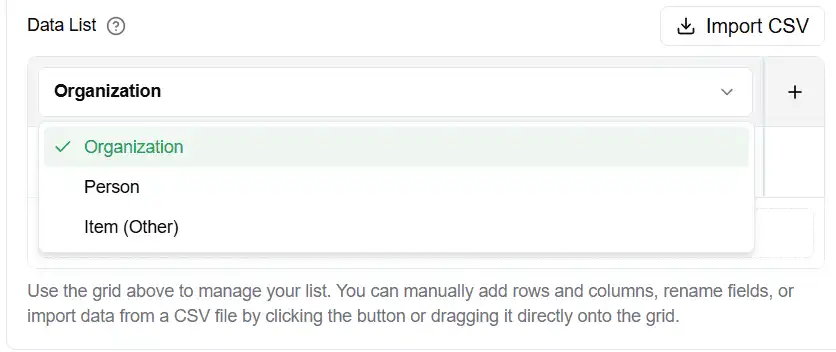
13. Define Data Type
Select the type of data you are working with.
 Available options:
Organization
Person
Item (Other)
14. Configure Your Condition
Write a condition that will be applied to each item in your list.
Example:
Company is mentioned online in the past 7 days
You can also use variables like:
@Organization
The clearer your condition, the more accurate the results.
15. Create Alert Group
Click Create Alert Group to activate monitoring.
The system will automatically create individual alerts for each item in your list.
Note: You can edit your list at any time. When you add or remove items, the system will automatically update the alerts.